
Real GDP Slows; Modest Improvement Expected in Q2-26
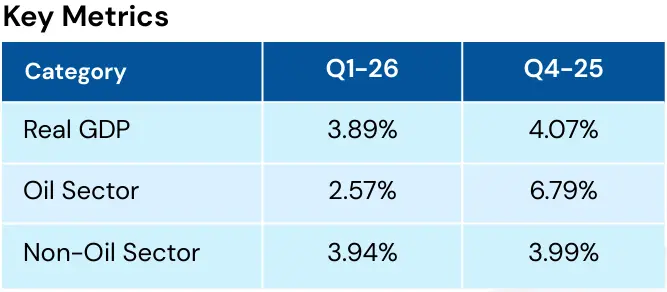
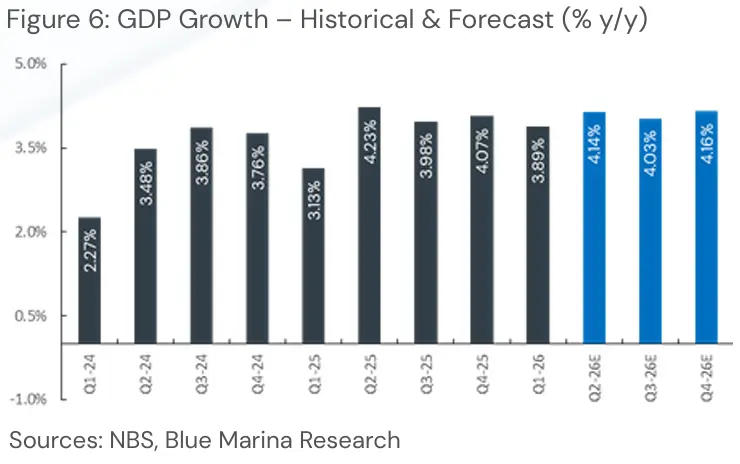
According to the latest Gross Domestic Product (GDP) report released by the National Bureau of Statistics (NBS), Nigeria’s real GDP expanded by 3.89% y/y in Q1-26 (Q4-25: 4.07% y/y). The softer growth reflects the typical seasonal slowdown witnessed at the beginning of the year, with both the oil (+2.57% y/y vs. Q4-25: +6.79% y/y) and non-oil (+3.94% y/y vs. Q4-25: +3.99% y/y) sectors moderating during the quarter. Despite the slowdown, the economy remained relatively resilient, supported by stronger growth across the services and manufacturing sectors, which helped offset weaker performances in agriculture and oil production.
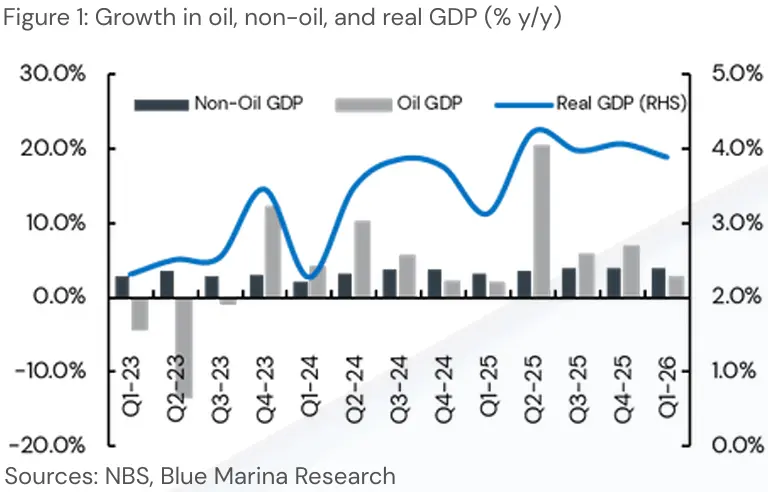
Oil Sector Slows as Production Faces Operational Challenges
The oil sector remained in positive territory, although growth slowed significantly to 2.57% y/y in Q1-26 (Q4-25: 6.79% y/y). Average crude oil production dropped to 1.55mb/d (Q4-25: 1.58mb/d |Q1 25:1.62mb/d), reflecting a combination of planned maintenance activities and operational disruptions across key production assets.
For context, the weaker performance was largely driven by maintenance-related shutdowns, particularly at the Bonga terminal (-43.1% y/y), alongside operational setbacks such as the Trans Forcados Pipeline outage, delays in bringing some production assets back online, and lingering infrastructure constraints.
Production declined across several major terminals, including Forcados (-11.3 y/y), Bonny (-7.1% y/y) and Escravos (-1.4% y/y), although stronger output from Utapate (+38.2% y/y), Qua Iboe (+14.6% y/y), and Erha (+0.6% y/y) cushioned the impact.

Non-Oil Sector Continues to Drive Economic Growth
The non-oil sector remained the key growth engine of the economy, accounting for 96.08% of total GDP during the quarter. Although growth eased marginally to 3.94% y/y from 3.99% in Q4-25, the sector continued to demonstrate resilience despite tighter financial conditions and lingering structural challenges. We believe the relative stability of the naira helped moderate imported input costs for businesses, while easing inflationary pressures supported household consumption during much of the quarter. These factors, alongside sustained growth in the digital economy and financial services industry, helped cushion the typical post-festive slowdown.

Services Sector Remains the Economy’s Bright Spot
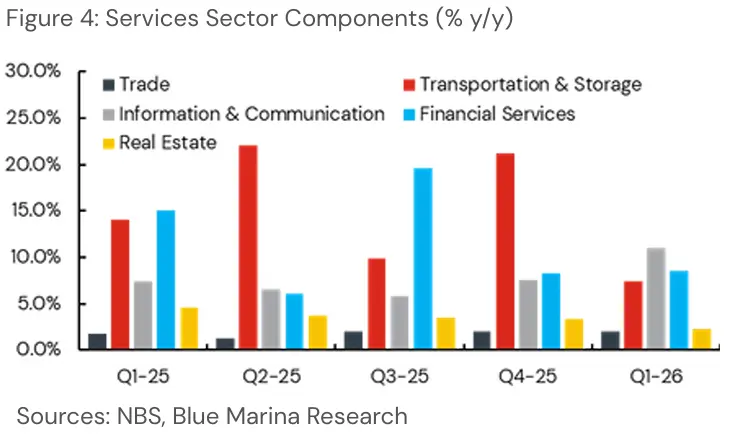
The services sector expanded by 4.31% y/y in Q1-26 (Q4-25: 4.15%), remaining the largest contributor to non-oil growth.
Within the sector, the ICT sector continued to stand out, recording growth of 10.98% y/y compared to 7.55% in Q4-25.
We attribute this strong performance to increased demand for voice and data services, supported by continued growth in broadband penetration and telecom subscriber numbers.
Higher data consumption and the gradual impact of the 2025 telecom tariff adjustment also provided additional support for the sector.
Similarly, financial and insurance services remained resilient, expanding by 8.54% y/y (Q4-25: 8.30% y/y) as elevated interest rates continued to support banks’ earnings, while increased digital payment activities sustained transaction volumes across the financial system.
The trade sector (2.08% y/y vs Q4-25: 2.00% y/y) also improved modestly, benefiting from relatively stable exchange rates and softer inflation during the early part of the quarter.
However, spending conditions remained constrained by weak household purchasing power.
On the other hand, transportation activity (7.41% y/y vs Q4-25:
21.25% y/y) eased, as higher fuel prices, softer post-festive travel demand, and heightened insecurity across key transport corridors weighed on both passenger and freight movement.
Real estate activity (2.29% y/y vs Q4-25: 3.43% y/y) also remained subdued, reflecting elevated construction costs, high borrowing rates, and affordability challenges.
Manufacturing Activity Strengthens
The manufacturing sector recorded one of the greatest improvements during the quarter, growing by 3.29% y/y compared to 1.13% y/y in Q4-25.
The improved performance was driven by stronger activity in the cement (11.53% y/y vs Q4-25: 4.12% y/y) and food, beverage, & tobacco (4.10% y/y vs Q4-25: 2.25% y/y) segments. We believe sustained government infrastructure spending, ongoing road and bridge projects, and stronger regional export demand supported cement production during the period. Likewise, easing foreign exchange pressures and improved availability of imported inputs helped support production across the food and beverage industry.
A major highlight was the oil refining segment (37.46% y/y vs Q4-25: 12.33% y/y), which recorded significant expansion as domestic refining capacity continued to improve. Increased output from local refineries provided additional support to manufacturing activity and reduced reliance on imported refined products.
However, structural challenges continued to weigh on the textile, apparel, and footwear subsector (-1.22% y/y vs Q4-25:-2.68% y/y), as elevated production costs, weak consumer demand, power supply issues, and competition from cheaper imports remained significant constraints.

Agriculture Growth Moderates Amid Seasonal and Security Challenges
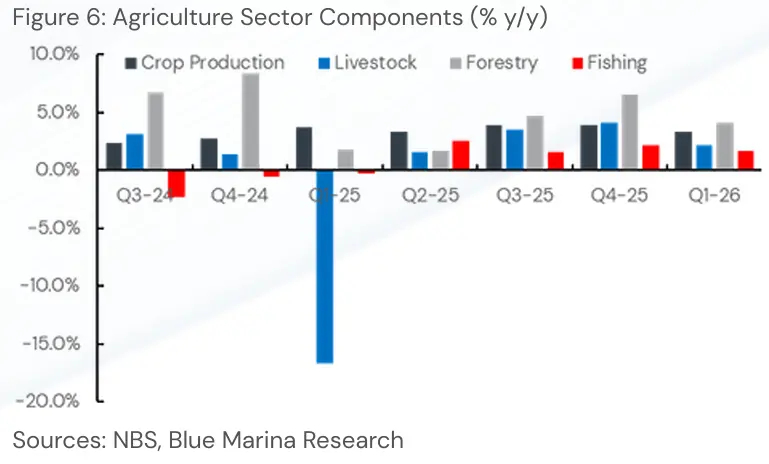
Growth in the agricultural sector slowed to 3.15% y/y in Q1-26 (Q4-25: 4.00% y/y), primarily reflecting lower crop production (3.39% y/y vs Q4-25: 3.94% y/y) associated with the typical post-harvest moderation. Persistent insecurity across major farming regions also continued to disrupt farming activities and food supply chains. Although the livestock (2.20% y/y vs Q4-25: 4.07% y/y) segment maintained positive growth, the pace moderated due to softer post-festive demand and elevated feed costs. Fishing (1.72% y/y vs Q4-25: 2.15% Y/Y) and forestry (4.14% y/y vs Q4-25: 6.52% y/y) activities also expanded at a slower pace during the quarter.
Outlook: Moderate Recovery Expected in Q2-26
Oil GDP: We expect oil sector growth to improve modestly in Q2 26 as crude oil production gradually normalises following the maintenance-related disruptions experienced during the first quarter. We estimate crude oil production (including condensates) to average 1.70 mb/d in Q1-26 (Q1-25 average: 1.55 mb/d), underpinned by the completion of key turnaround maintenance programmes and improved operational.
Nonetheless, we acknowledge downside risks stemming from ageing infrastructure, crude oil theft and operational bottlenecks. Accordingly, we project oil sector growth at 3.09% y/y in Q2-26.
Non-Oil GDP: We expect the non-oil sector to remain the major driver of economic growth, supported by continued expansion in ICT, financial services, and domestic refining activities. Stable foreign exchange conditions should continue to support business activity, although elevated energy prices and tight financial conditions could moderate growth across some sectors. Based on the preceding, we project that the non-oil sector will grow by 4.42% y/y in Q2-26.
Agriculture: We estimate agricultural growth to improve modestly to 3.40% y/y, supported by festive-related demand and seasonal farming activities. Nonetheless, insecurity, elevated input costs, and logistics challenges are likely to remain key constraints.
Services: We expect the services sector to maintain its strong momentum, supported by sustained growth in telecommunications, digital payments, and financial services.
Sustained expansion in broadband penetration and rising data consumption should underpin ICT growth, while banking sector earnings are likely to remain supported by the prevailing interest rate environment. Accordingly, we forecast services sector growth of 4.52% y/y.
Manufacturing: We expect manufacturing growth to moderate to 2.97% y/y as higher energy costs, increased input costs, tight financial conditions, and the onset of the rainy season weigh on activity across key industries. However, continued expansion in domestic refining capacity and resilient food production should help support the sector.
On a balance of factors, we expect the Nigerian economy to remain resilient in Q2-26, driven primarily by continued strength in the non-oil sector. While structural challenges in the oil sector and lingering cost pressures across the economy remain key risks, improving crude oil production, relatively stable foreign exchange conditions and sustained expansion in the digital economy should support a moderate acceleration in growth.
Consequently, we project real GDP growth of 4.14% y/y in Q2 26 and estimate 2026FY growth to settle at 4.23% y/y
Important Information: Disclaimer
Blue Marina Asset Management Limited (“Blue Marina”) reports and its attendant recommendations are prepared based on publicly available information and are meant for general information purposes only and it may not be reproduced or distributed to any other person. All reasonable care has been taken to ensure that the information contained herein is not misleading or untrue at the time of publication; Blue Marina Asset Management Limited can neither guarantee its accuracy nor completeness as they are an expression of our analysts’ views and opinions.
Blue Marina Asset Management Limited and any of its associated or subsidiary companies or the employees thereof cannot be held responsible for any loss suffered by relying on the said information as this information as earlier stated, is based on publicly available information, analysts’ estimates and opinions, and is meant for general information purposes and should not be construed as an offer to buy or sell or a solicitation of an offer to buy or sell securities or any financial instruments. The value of any investment is subject to fluctuations, i.e., may fall and rise. Past performance is no guide to the future. The rate of exchange between currencies may cause the value of investment to increase or diminish. Hence investors may not get back the full value of their original investment.
Blue Marina Asset Management Limited is registered and regulated by the Securities and Exchange Commission, Nigeria. Registered office: 10 Keffi street, Off Awolowo Road, Ikoyi, Lagos, Nigeria.
Company Info
Blue Marina Asset Management
Phone No.: +234 916 641 7513
Email: info@bluemarinaam.com
Website: www.bluemarinaam.com;
© Blue Marina Asset Management 2026.
Research Team
research@bluemarinaam.com
Analyst
Emmanuel Nwamaka
e.nwamaka@bluemarinaam.com